Category: GeoGebra Tutorials
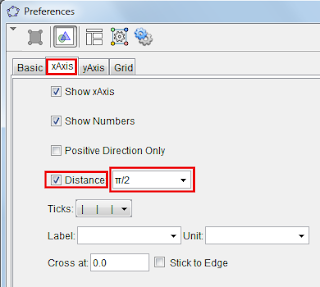
GeoGebra Tutorial: How to change the x-interval to pi or pi/2
.
GeoGebra Tutorial: Constructing a Cardioid
1. Construct point A at (0,0) and point B at (0,1).
2. Construct a circle with center A and passing through B.
3. Construct an angle slider and set the minimum number to 0°, maximum number to 360° degrees and increment of 2°.
4. Construct angle BAB‘. To do this, select the Angle with Given Size tool, click on point B and click on point A to display the Angle with Given Size dialog box.
5. In the Angle with Given Size dialog box, replace 45° with α, choose counterclockwise button, and then click OK.
6. Hide the green sector by right clicking it and then clicking on the Show Object from the pop up menu.
7. Now construct a circle with center B‘ and passing through B.
8. Right click the circle with center B and click Trace on.
9. Move the slider and observe what happens.
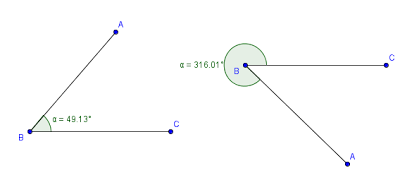
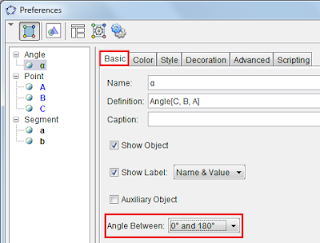
GeoGebra Tutorial: How to Disable Reflex Angles
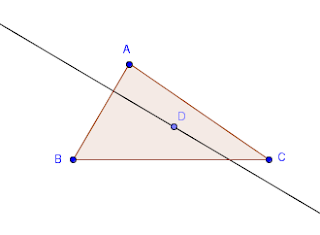
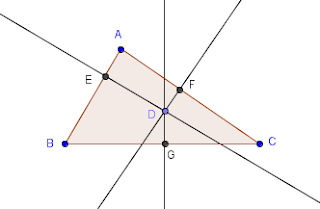
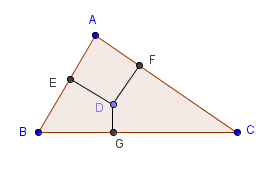
GeoGebra Tutorial: Using the Perpendicular Line and the Point on Object Tools
Steps in Creating the Applet
Application
How to Embed An Applet in a Blogspot Post
1.) Open the GeoGebra worksheet that you want to embed in a Blogspot post.
2.) Export the GeoGebra worksheet as HTML. This will display the exported worksheet as an applet in a web browser.
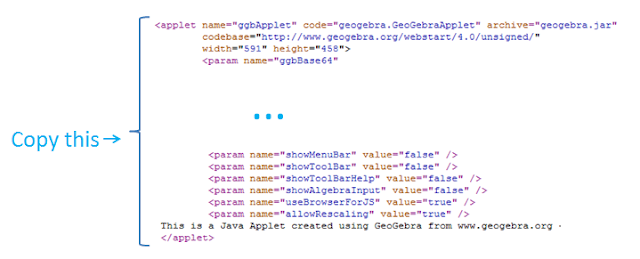
4.) In the source code window, copy the applet code; that is, copy the text from <applet> to </applet>
5.) Open the Blogspot post where the applet is to be inserted, and then select the HTML button to display its HTML view.
6.) Paste the applet code on a location that you want it to appear
7.) Select the Compose button to go back to the text view or click the Preview button to view how the applet will look like.
8.) Click the Save button.
Tutorial 6 – Exporting Worksheet as HTML
To explort w Worksheet as a Dynamic HTML, do the following:
1.) Open the GeoGebra file that you want to export as HTML.
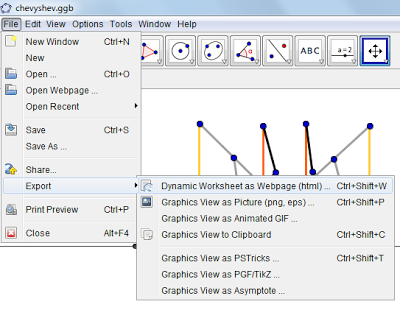
2.) Select the File menu, click Export, and then click Dynamic Worksheet as Web Page(html).
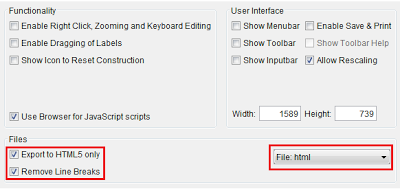
3.) In the Dynamic Worksheet Export dialog box, select Export as Webpage tab.
Free, Semi-free, and Dependent Objects
Tutorial 5 – Graphs and Sliders
| No | Tools | Instructions |
| 1 | Open GeoGebra and use the View menu to display the coordinate axes. | |
| 2 |  |
Select the Slider tool and click on the Graphics view to display the Slider dialog box. |
| 3 | In the slider dialog box, select Number from the option buttons, and leave the other options as is. GeoGebra will automatically givea as the slider name. |
|
| 4 | Now create slider b similar to slider a. | |
| 5 | Type f(x) = a*sin (x) + b in the input bar and press the ENTER key to graph it. | |
| 6 | Move the small circles on both sliders. What do you observe? |
Tutorial 4 – Graph, Text, and Latex
Tools: Insert Text

| No | Tool | Instructions |
| 1 | Open GeoGebra. Use the View menu to display the coordinate axes. | |
| 2 | Type y = – x + 4 to construct a line passing through A and B. | |
| 3 | Type f(x) = 0.5x^2 – 4.5x + 9 to construct a parabola passing through points A and B. | |
| 4 | To construct the intersection, type A = (2,2) and B = (5,-1) in the input bar and press the ENTER key after each equation. | |
| 5 |  |
We label the graphs. To label the graph of the quadratic function, click the Insert Text tool, and click on the Graphics view near the graph of the quadratic function to display the Text dialog box. |
| 6 | In the text dialog box, type f(x) = 0.5x^2 – 4.5x + 9 in the Edit text box, then click the Latex formula check box to check it, and then click the OK button. Notice what happens to the text. | |
| 7 | Now, label the graph of the linear function and the coordinates of A and B with (2,2) and (5,-1) respectively. |
