Slope and y-intercept

Move sliders m and b below to investigate the graph of y = mx + b.

Questions

  1. How does the value of m and b affect the graph of y = mx + b?
  2. .Without using GeoGebra, explain and justify what should be the values of m and b so that the graph passes through
    • Quadrants I, II, and III
    • Quadrants I, II, and IV
    • Quadrants I and III only
    • Quadrants III and IV only
  3. Explain and justify why
    • m > 0 when the graph slants to the right.
    • m < 0 when the graph slants to the left.
    • m = 0 when the graph is horizontal.

Pythagorean Theorem

Four right triangles with sides a, b, and hypotenuse c, are arranged to form square GHIJ. You may adjust the size of the triangles by moving point G and their shape by moving point Q. Answer questions 1 and 2 first before moving the slider.

1) What type of quadrilateral is the white region? Justify your answer.

2) What is the area of the quadrilateral in (1)?

3) Move slider R to the extreme right to show slider T. Then, move slider T to the extreme right. What type/s of quadrilateral are the two white regions? Justify your answer.

4.) What are the areas of the quadrilaterals in (3)?

5.) How does the area of the quadrilateral in (1) relate to the areas of the quadrilaterals in (3)?

6.) What equation can we form from the relationship in (4) in terms of a, b, and c?

Visual Proof of Pythagorean Theorem

Shown below is a triangle whose sides form squares with sides a, b, and c.

1.) Move slider p to the extreme right.

 
What is the relationship among the squares when p was on the extreme left and the quadrilaterals when p was on the extreme right? 

2.) Move slider q to the extreme right.

What is the relationship among the quadrilaterals when q was on the extreme left and when q was on the extreme right?   

3.) Move slider r to the extreme right.

What is the relationship among the quadrilaterals when r was on the extreme left and when r was on the extreme right?   

4.) Based on your exploration, what is the relationship among the areas of the squares with side lengths a, b, and c?

5.) Using the variables, a, b, and c write an equation about the relationship you found in 4.

Dice Rolling Simulation

Click the Roll Dice button and record the sum of the number of dots. Do this for 20 times and tally the result.


Questions1.) What do you observe?
2.) Which sum occurs more often? less often?
3.) Do the simulation for 30 times, 40 times, 50 times, 100 times. Are your observations still the same?
4.) Explain why your observations are such.

The Infinite Chocolate Puzzle

View the video below and observe what happens. Can you tell where did the extra chocolate come from?

Now, explore the GeoGebra applet below by moving point A (up and down) and moving points B and C along the diagonal.

  1. What do you observe about the video and the applet?
  2. Are the video and applet similar? 
  3. Where did the extra chocolate come from? 

Thumbnail


 Created with GeoGebra by Guillermo Bautista

The Date Problem

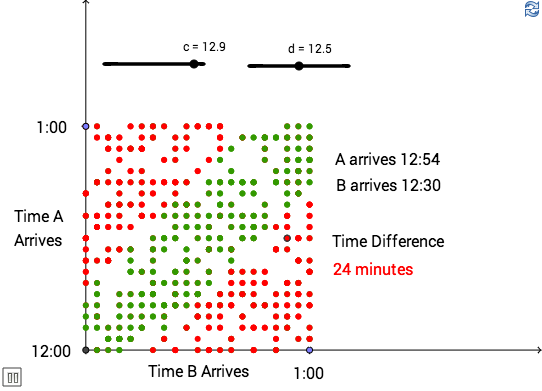
You and a friend arrange to meet between 12:00 and 1:00 in the afternoon. After a week neither of you remembers the exact meeting time. As a result, it is possible for you arrive at random between 12:00 and 1:00 and waits exactly 15 minutes for your friend to arrive. After 15 minutes, each of you leaves if the other person has not arrived. What is the probability that the two of you will meet?

Click the Play button at the bottom left of the applet.


Explore!

1.) Click Pause and see the exact time the two friends arrive.
2.) Refresh the browser to delete the point traces.
3.) Click Pause and drag the sliders to customize the time arrival.

***

Problem by Erlina R. Ronda
Created with GeoGebra by Guillermo P. Bautista Jr

Thumbnail

1 2 3 5