Approximating Pi

Move slider n to the right and observe what happens to the inscribed polygon.
 
The applet above shows the relationship between the area of a circle and the inscribed polygon.  Notice that as the the number of sides (n) of the inscribed polygon increases, its area gets closer and closer to the area of the circle which is equal to .  This approximation is called the method of exhaustion. It was developed used by Archimedes.

GeoGebra External Tutorials

GeoGebra Tutorials


Tutorial 5 – Graphs and Sliders

Objective: To explore the effects of a and b in the graph f(x) = a sin(x) + b.

No Tools Instructions
1
Open GeoGebra and use the View menu to display the coordinate axes.
2 slider.png Select the Slider tool and click on the Graphics view to display the Slider dialog box.
3
In the slider dialog box, select Number from the option buttons, and leave the other options as is. GeoGebra will automatically givea as the slider name.

slider-dialog-box.png
4
Now create slider b similar to slider a.
5
Type f(x) = a*sin (x) + b in the input bar and press the ENTER key to graph it.
6
Move the small circles on both sliders. What do you observe?

< Previous Tutorial

Tutorial 4 – Graph, Text, and Latex

Objective: To construct graphs of linear and quadratic functions.
Tools: Insert Text

graph.png


No Tool Instructions
1
Open GeoGebra. Use the View menu to display the coordinate axes.
2
Type y = – x + 4 to construct a line passing through A and B.
3
Type f(x) = 0.5x^2 – 4.5x + 9 to construct a parabola passing through points A and B.
4
To construct the intersection, type A = (2,2) and B = (5,-1) in the input bar and press the ENTER key after each equation.
5 text.png We label the graphs. To label the graph of the quadratic function, click the Insert Text tool, and click on the Graphics view near the graph of the quadratic function to display the Text dialog box.
6
In the text dialog box, type f(x) = 0.5x^2 – 4.5x + 9 in the Edit text box, then click the Latex formula check box to check it, and then click the OK button. Notice what happens to the text.
7
Now, label the graph of the linear function and the coordinates of A and B with (2,2) and (5,-1) respectively.

< Previous Tutorial ** Next Tutorial >

Tutorial 3 – Angles and Object Properties

Objective: To use the Angle tool, Styling Bar and Object Properties.Tools: Angle

rhombus-1.png


No Tool Instructions
1
Open the Tutorial 2 file. Use the View menu to hide the Algebra view.
2 angle.png To measure angle BAC, select the Angle tool, and click points BAC in that order. Notice that an angle symbol appears on angle A. Use the same tool to measure the remaining interior angles. For the mean time, ignore the reflex angles.
3
Click the angles and change their colors on the Styling Bar located at the upper-left of the Graphics view. Apply similar colors to congruent angles.

styling-bar.png
4
To disallow reflex angles, right click on angle A* (right click the sector), and select Object Properties from the pop-up menu.
5
In the Object Properties window, click the Basic tab, and uncheck the Allow Reflex Angle check box, and click the Close button. Repeat the process to disallow reflex angles on other interior angles.


< Previous Tutorial ** Next Tutorial >

Tutorial 2 – Lines, Circles, and Angles

Objective: To constructt a rhombus and display the measure of its interior angles.Tools: Compass, Parallel Line, Angle

rhombus.png
No Tool Instructions
1 segment.png Construct segment AB.
2 compass.png Select the Compass tool, click on the segment and then click on A. This will form a circle with center A and passing through B.
3 point.png Construct point C on the circle.
4 segment.png Construct segment BC. Move point C, what do you observe?
5 Right click on the circle and then click Show Object from the pop-up menu to hide it.
6 parallel.png To construct a line parallel to AB passing through C, select the Parallel line tool, click on segment AB, and then click on point C. Now, use the same tool to construct a line parallel to AC and passing through B.
7 intersect.png Now, intersect the two lines to form the fourth vertex of the rhombus. Hide the two lines and construct segments BD and CD.
8 segment.png Hide the two lines by right clicking them and clicking Show Object, and then construct segments BD and CD.

< Previous Tutorial ** Next Tutorial >

Tutorial 1 – Points, Segments, and Intersections

Objective: To construct a triangle and find its centroid.Tools: Move, New Point, Segment between Two Points, Midpoint or Center, Intersect Two Objects

No Tool     Instruction
1
point.png
Select the New Point tool and click three different locations on the Graphics view.
2 segment.png To construct side AB, select the Segment between Two Points tool click point A, and then click point B.
Use the same tool to construct segments AC and BC .
3 move.png Select the Move tool and drag the points. What do you observe?
4 midpoint.png To construct the midpoint of AB, select the Midpoint or Center tool, click point A, and then click point B. Now, get the midpoints of AC and BC. After this step, your drawing should look like the following figure.

triangle-centroid.png
5 segment.png To construct the medians, use the Segment between Two Points tool to construct segments AFBE, and CD, the medians of the triangle.
6 intersect.png To intersect the medians, select the Midpoint or Center tool, and then click any of the two medians.

Explore More!

  • Move points AB, and C. What do you observe about the medians?
  • What conjecture can you make about the medians of a triangle?
  • Move the points and the segments on the figure. Which objects can/can’t be moved? Why?

Next Tutorial >

    The GeoGebra Toolbar

    The GeoGebra toolbar is used for drawing and exploring objects. The tools are categorized into twelve as shown below. In each category, the default tool is displayed. For example, in the Special Line tools, the Perpendicular line is the default tool.


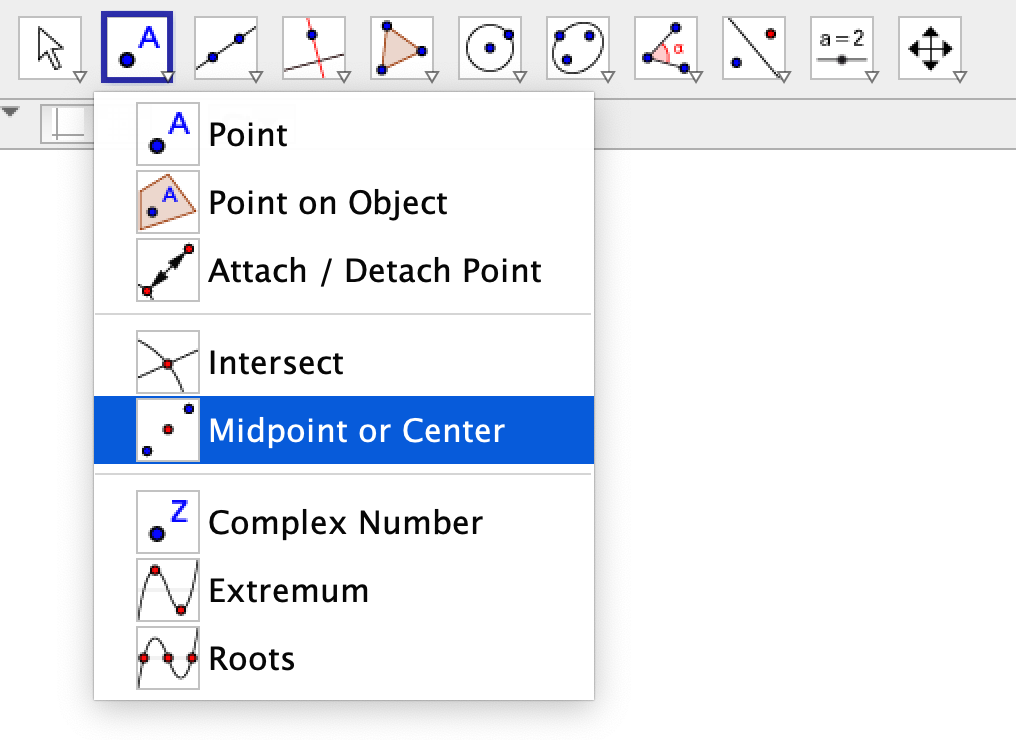
    More tools in each category can be displayed by clicking the triangle at the bottom-right of each tool. Once the list of tools is displayed, the user can select a tool by clicking on it. The icon of the selected tool will then be displayed on the toolbar.


    The selected tool is highlighted by the blue border as shown in both figures. To deselect a tool, you can click on the Move tool or press the Esc key on your keyboard.

    1 2